Advanced Pipeline Metrics for RevOps: The 2025 Blueprint for Predictable Revenue

Why Advanced Pipeline Metrics Matter in Modern RevOps
Revenue Operations (RevOps) has evolved from simple reporting into a sophisticated, strategy-driven discipline. Gone are the days when leaders could rely solely on traditional KPIs like win rate, ramp time, and quota attainment. In 2025, high-performing organizations have realized these foundational metrics are only the beginning—the real competitive advantage comes from mastering advanced pipeline metrics.
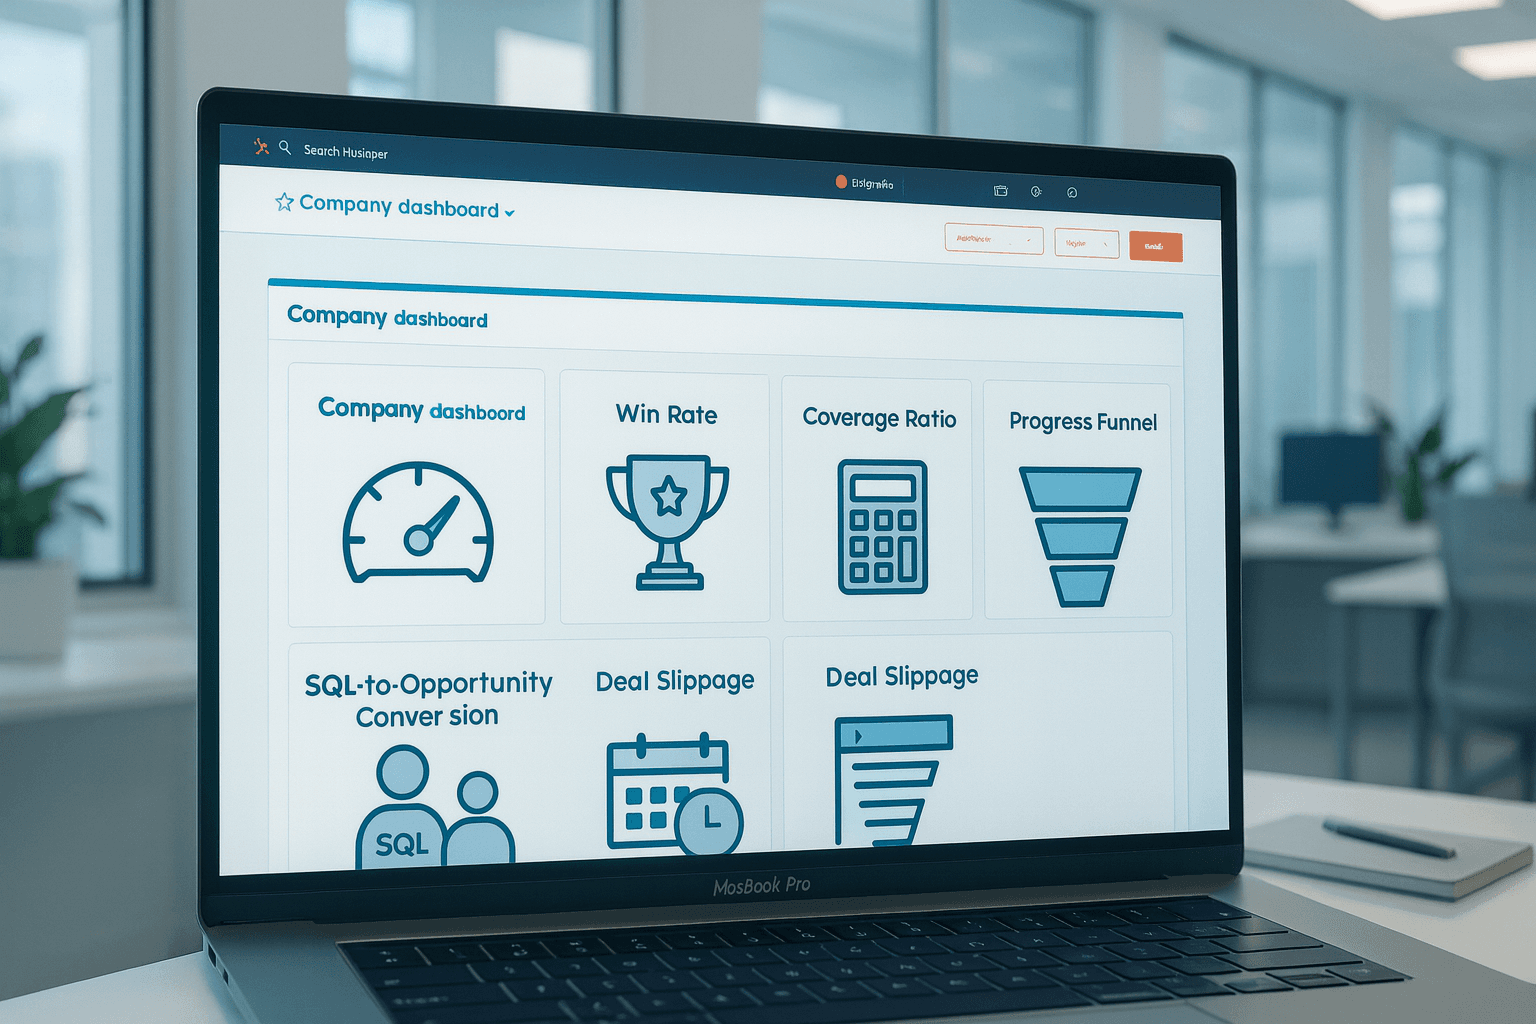
Why does this shift matter? Because business environments are more volatile. Buying journeys zigzag, decisions span multiple teams, and the pipeline is flooded with data yet starved of clarity. With global research showing AI-powered RevOps teams closing deals 25% faster and hitting 15% higher win rates than their competitors, the companies embracing advanced pipeline metrics like pipeline velocity, SQL-to-opportunity conversion, coverage ratio, and deal slippage are outpacing their industries.
A healthy pipeline is measured daily, not monthly, using real-time dashboards and predictive models. Executives and frontline enablement teams leverage actionable insights—flagging risks before deals stall, segmenting pipelines with precision, and forecasting outcomes with confidence. Advanced pipeline metrics are now the linchpin of scalable revenue and the ultimate driver of operational alignment across sales, marketing, and customer success. Without them, your RevOps motion is falling behind.

What Are Advanced Pipeline Metrics?
In the new era of RevOps, metrics are more than numbers—they are living narratives about your business, each telling a unique story about revenue potential, risk, and opportunity. Advanced pipeline metrics dive beneath the surface of simple activity counts and track the real pulse of your sales engine. Here are the most crucial metrics every RevOps leader must understand and operationalize:
- Pipeline Velocity: This metric evaluates how quickly your deals move from first engagement to close. Think of it as the "revenue speedometer" for your organization. If velocity slows, so does your growth trajectory. Tracking pipeline velocity helps you isolate bottlenecks, forecast cash flow, and optimize resource allocation in real time. Without it, blind spots in your sales process can cost millions—or entire market segments.
- Win Rate Optimization: Beyond simply tracking closed-won deals, advanced teams focus on segmenting win rates by product line, sales representative, and funnel stage. This granular view allows you to pinpoint and act on precise process improvements, tailor playbooks for different personas, and measure the true impact of enablement efforts. Industry leaders benchmark win rates obsessively, using dynamic A/B tests and fast feedback loops to stay ahead.
- Pipeline Coverage Ratio: This ratio reveals how much pipeline is actually required to hit sales quotas or aggressive revenue targets. If coverage slips below industry benchmarks—typically 4x pipeline for high-growth teams—you're no longer forecasting opportunity, but risk. Modern dashboards empower you to dynamically adjust strategies, reallocating marketing budgets, SDR efforts, and AE energy toward your most promising segments.
- SQL-to-Opportunity Conversion Rate: This is the heartbeat of marketing and SDR efficiency. A low conversion rate almost always points to gaps in qualification criteria or a broken lead handoff process between teams. Audit these flows regularly, using analytics to locate and plug pipeline leaks before they become revenue black holes.
- Deal Slippage Rate: When deals stall—delayed beyond their planned close date—your pipeline starts to rot. Tracking slippage and deploying AI-powered alerts equips managers to intervene earlier, reroute resources, and maintain forecast accuracy. The healthiest pipelines are those that move—consistently and predictably.
- Sales Cycle Length: Every additional day in your sales cycle drains pipeline velocity and increases exposure to competitive threats or market changes. Breaking cycle length down by segment and persona lets leadership pinpoint where enablement content, better automation, or streamlined contracting can deliver the biggest impact.
- Attribution Modeling (RevOps): Attribution isn't just a marketing challenge anymore. Modern RevOps models quantify the true influence of marketing campaigns, SDR touches, AE pitch styles, and even tech stack decisions on each closed-won deal. Refined attribution is how top teams decide where to double down in their go-to-market (GTM) strategy for predictable growth.
Example:
A SaaS company monitoring advanced pipeline metrics discovers a sharp drop in SQL-to-opportunity conversion rate. By reviewing qualification criteria and retraining SDRs on mapping buyer pain and urgency, the team restores conversion rates and recovers $500k in predicted revenue for the quarter.
2. The Pipeline Velocity Formula (and Why It Rules 2025)
Pipeline velocity is the metric that tells you not just how much revenue you're working toward, but how quickly it's moving through your organization. In 2025, it's the backbone of forecasting, strategic planning, and real-time coaching.
Pipeline Velocity Formula:
Pipeline Velocity = (Number of Opportunities × Average Deal Value × Win Rate) / Sales Cycle Length (days)Let's break this down:
- More opportunities means greater potential, but only if you maintain quality.
- A higher average deal value maximizes every movement through the funnel.
- Win rate is your ability to convert pipeline into actual revenue.
- Shorter sales cycles mean quicker, less risky wins.
Practical Example:
Imagine you have 18 pipeline opportunities, an average deal value of $28,000, a win rate of 40%, and a 56-day sales cycle:
Pipeline Velocity = (18 × 28,000 × 0.40) / 56 = $3,600 closed revenue per dayThat figure becomes your core growth engine. Leading RevOps teams set weekly targets for pipeline velocity and trigger manager reviews if numbers fall below thresholds. AI-powered tools even run "what if" scenarios—showing how increases in win rate or reductions in sales cycle length deliver exponential returns, not just incremental gains.
Use weekly velocity tracking to coach reps, rebalance resources, and steer QBRs with data-backed certainty. Velocity is your risk shield and growth catalyst.
3. Benchmarking and Real-Time Reporting Dashboards
Reporting in 2025 has become proactive, highly visual, and seamlessly integrated. Static spreadsheets are no longer acceptable when executives and teams demand answers in real time. Best-in-class dashboards merge live data from CRM systems like Salesforce or HubSpot, intelligent spreadsheets (think Coefficient AI), sales engagement platforms, and modern marketing analytics tools.
What does a world-class dashboard look like?
- Live Data Sync: Instant updates from every data source—one-click visualizations, zero manual export.
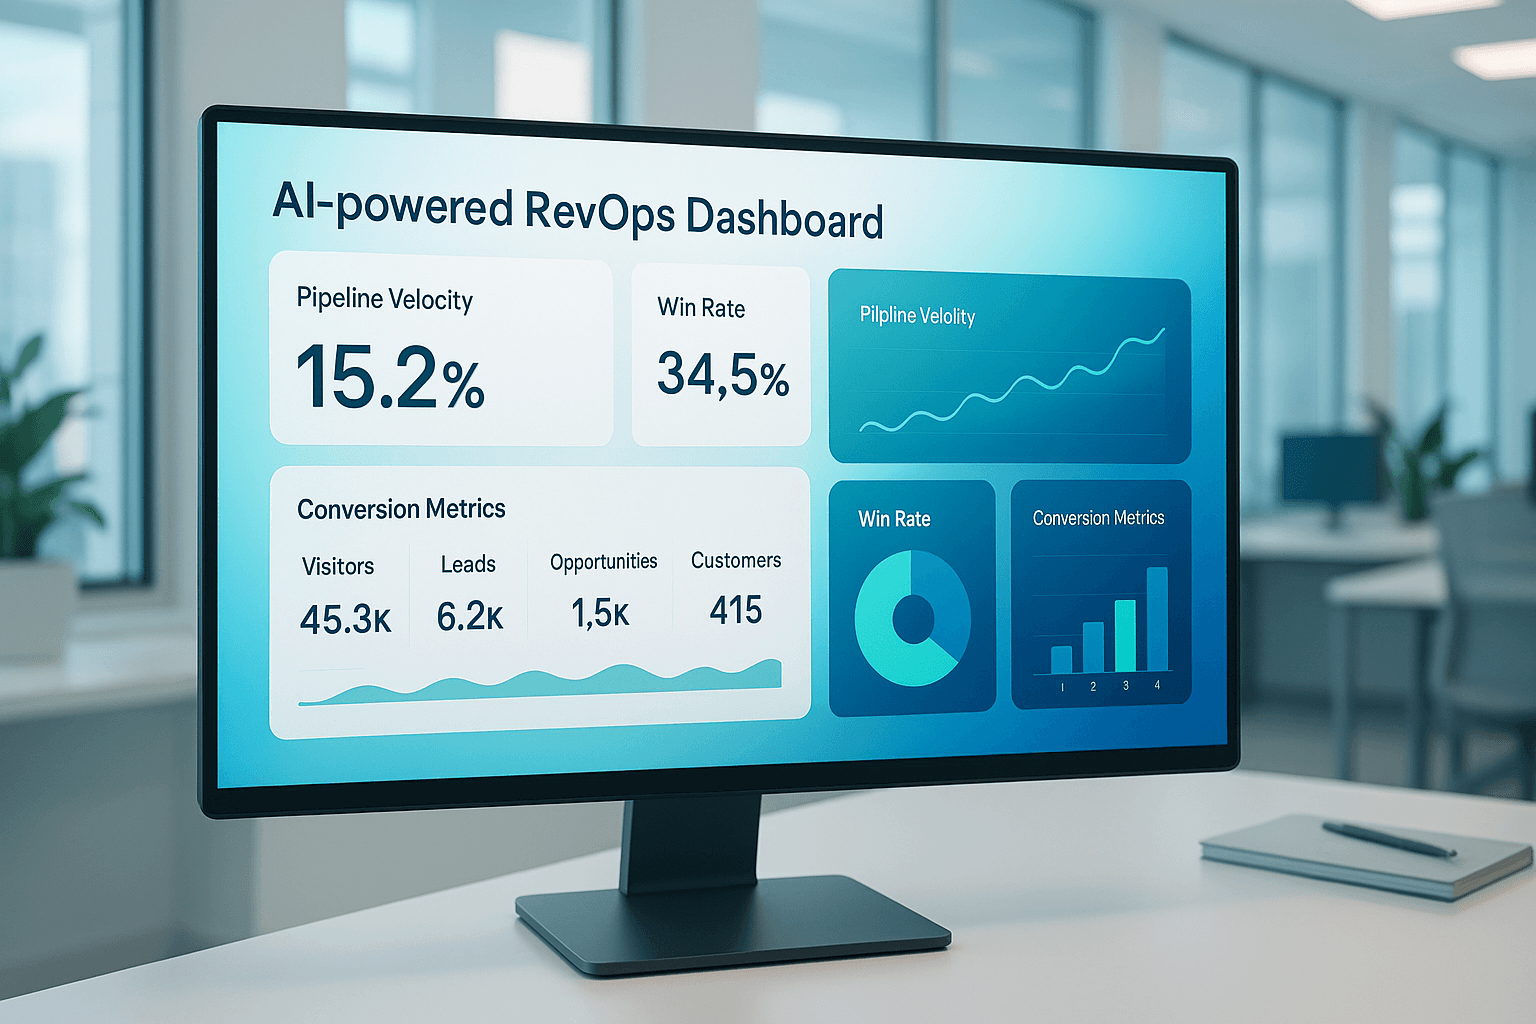
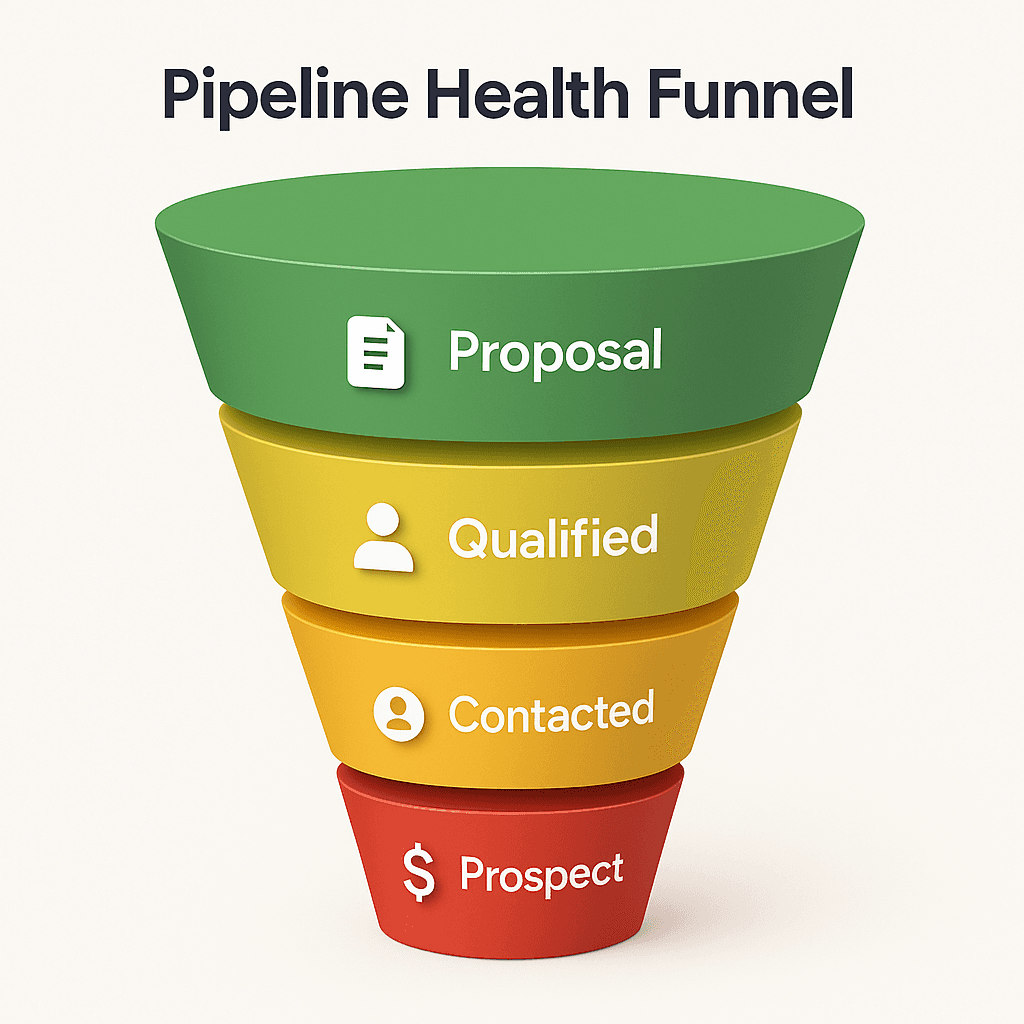
- Visual Pipeline Health: Progress bars, funnel drop-off charts, pie slices showing pipeline coverage, and color-coded risk indicators for rapid, at-a-glance analysis.
- AI-Powered Alerts: Predictive algorithms highlight slippage, conversion bottlenecks, or missed targets before they become systemic issues, allowing for proactive management.
- Benchmark Tables: Compare your figures to industry and segment top performers. Use actionable targets to drive accountability and continuous improvement.
Pipeline Dashboard Benchmark Table Example:
| Metric | Industry Average | Top Performer | Your Target |
|---|---|---|---|
| Pipeline Coverage Ratio | 3.0x | 4.5x | ≥4.0x |
| SQL-to-Opportunity Conversion | 19% | 26% | ≥22% |
| Deal Slippage Rate | 34% | 19% | ≤20% |
| Sales Velocity | Baseline | +18% | +10–15% |
Use Case:
A global B2B tech firm uses a reporting dashboard that pulls live pipeline data from HubSpot, Coefficient AI, and Salesforce simultaneously. The dashboard surfaces an unusually high deal slippage rate; managers drill into segments, discover a new pricing objection is the culprit, and retool their enablement materials within the week—restoring healthy pipeline flow and forecast accuracy.
4. Improving Pipeline Health: Conversion Rates, Cycle Length & Deal Slippage
Pipeline health directly correlates with your ability to forecast and grow predictably. Healthy means high conversion, low slippage, and short cycles—all underpinned by active, continual management.
Here's how advanced RevOps teams drive pipeline health:
- Segmentation: Break down pipelines by channel (inbound, outbound), deal type, and owner. This micro-segmentation allows for focused coaching and rapid remediation. If outbound enterprise deals are slow, it's a sign to introduce more targeted enablement or redesign the playbook for that segment.
- Slippage Monitoring: Use AI-powered alerts (Gong, Outreach, HubSpot AI) to monitor deals at risk. Intervention triggers are automated—managers receive slippage reports daily and reps get instant automated reminders to nudge stakeholders for momentum.
- Conversion Activation: Monitor critical conversion rates using dashboards and scheduled review meetings. If SQL-to-opportunity metrics drop, it's time to audit qualification criteria and refocus training on mapping buyer pain, identifying real decision-makers, and ensuring a smooth lead handoff between teams.
- Continuous Coaching: Top organizations combine AI insights from their dashboards with weekly pipeline review meetings and live deal clinics. The result? Shortened cycle times and fewer deals dying "on the vine."
Example Table of Activation Metrics:
| Metric | Goal | Best Practice |
|---|---|---|
| Lead Response Time | <60 minutes | Automated SDR assignment and chatbot triage |
| Deal Progression Rate | >85% advance weekly | AI nudges + playbook walkthroughs |
| Engagement Score | ≥65% platform usage | Smart content recommendations via AI |
| Content Utilization | >50% of wins use core assets | Audit library and refresh quarterly |

5. AI, Automation & Top Software for RevOps Metrics
As artificial intelligence and automation become centerpieces of RevOps, the platform landscape is evolving at unprecedented speed. Today, the most effective RevOps teams leverage not just one, but a full stack of AI-enhanced tools that combine CRM, reporting, enablement, and data quality across the revenue organization.
Top AI Tools for RevOps Success in 2025:
- Coefficient AI: Transforms ordinary spreadsheets into real-time, interactive revenue dashboards. No coding required—just natural language formulas and instant charts for actionable insights.
- Gong: Uses AI to analyze sales conversations, flag pipeline risks, and coach reps at massive scale, enabling predictive management of deal flow.
- HubSpot AI: Embeds AI scoring, predictive automation, and unified reporting across marketing, sales, and customer success teams for seamless data flow and process optimization.
- Outreach & SuperAGI: Automate follow-up cadences, alert on active deal risk, and sequence tasks for every stage of the pipeline so deals don't get stuck or forgotten.
- Monday.com & BigContacts: Create custom dashboards, view pipeline stages in real time, and run dynamic reporting for every segment, product, and region. This brings visibility and accountability to every part of the commercial engine.
| Tool | What It Does | Impact |
|---|---|---|
| Coefficient AI | Live spreadsheet sync, NLP reporting | Dashboards in seconds |
| Gong | Conversation analysis, alerts, coaching | Pipelines stay healthy |
| HubSpot AI | Predictive scoring, automations | Unified RevOps reporting |
| Outreach, SuperAGI | Automated follow-ups, risk alerts | Higher win rates, reduced slippage |
| Monday.com, BigContacts | Dashboards, pipeline views | Live stage tracking |
Practical Impact:
A high-growth B2B team using Coefficient AI and Gong found that automated weekly reporting and AI-powered pipeline coaching cut deal slippage by 27%. HubSpot AI's predictive lead scoring helped them focus on the top 30% converting leads, boosting SQL-to-opportunity rates by 6 points in just one quarter.
Leverage these tools not just for reporting, but to enable smarter playbooks, focused training, and continuous pipeline improvement.
6. Frequently Asked Questions (FAQ)
Conclusion: Your Roadmap for Data-Driven RevOps Growth
Advanced pipeline metrics are your ticket to scalable, predictable, AI-powered revenue. Master pipeline velocity, win rates, and operationalize real-time data for lasting advantage.
For in-depth playbook strategies, see Sales Enablement Playbook 101.
Ready to transform your RevOps strategy? Let's discuss how advanced pipeline metrics can drive predictable revenue growth for your organization.
